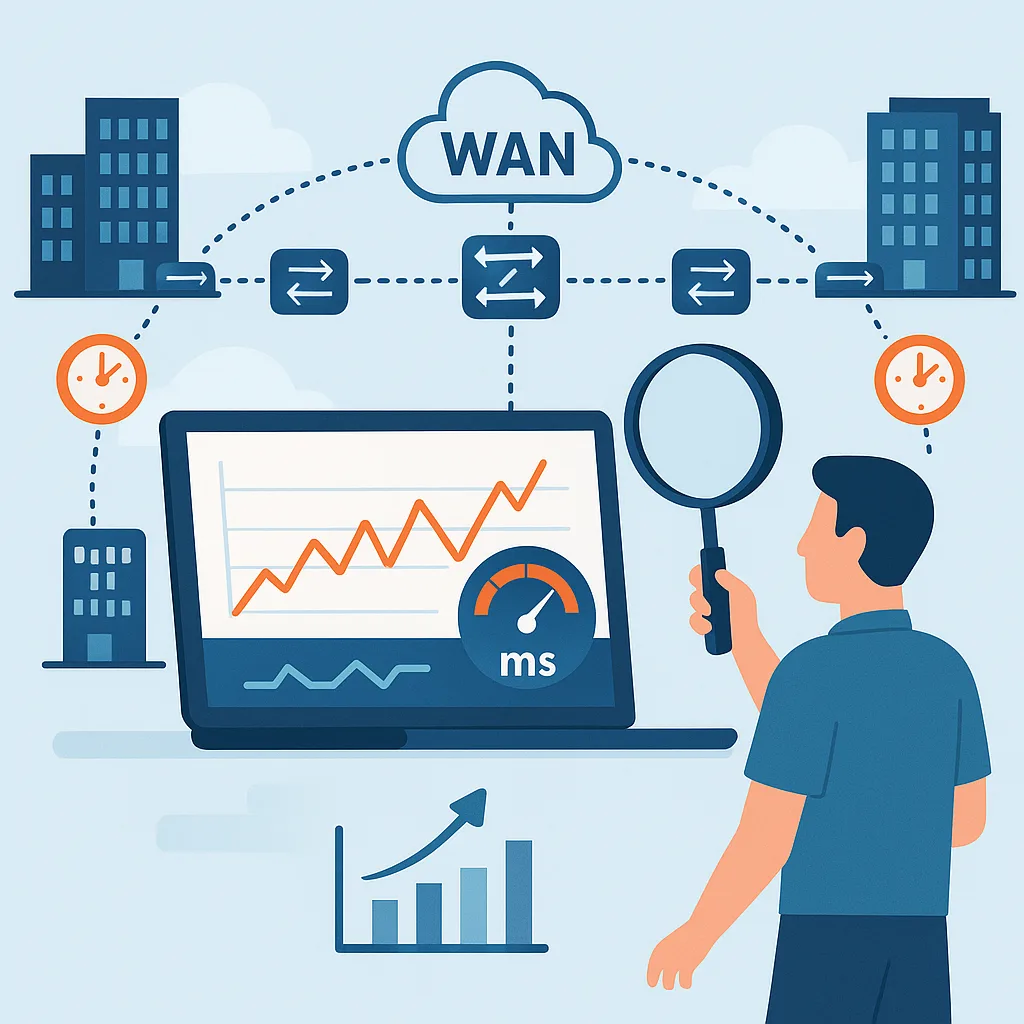
When users start complaining that “the network is slow,” it’s often an issue of high latency—especially over Wide Area Network (WAN) links. Whether connecting branch offices, data centers, or cloud resources, WAN latency can be caused by a wide range of issues: congestion, routing problems, misconfigurations, or even physical layer faults.
This article outlines practical steps and tools to monitor, analyze, and troubleshoot high latency across WAN links—so you can minimize downtime and keep applications responsive.
What Is WAN Latency?
Latency refers to the delay between sending a packet and receiving a response. In WAN environments, this delay is influenced by:
- Geographic distance
- Routing complexity
- Congestion and queuing
- Packet loss and retransmissions
- Quality of Service (QoS) misconfigurations
High latency results in slow file transfers, laggy video calls, delayed app responses, and user frustration.
Key Symptoms of High WAN Latency
- Delayed response times in remote desktop sessions
- Sluggish file access over mapped network drives
- Timeouts in VoIP and video conferencing
- Slow cloud or SaaS app performance
- Application disconnections
Tip 1: Establish a Baseline
Before troubleshooting, you must understand what “normal” latency looks like in your environment. Use tools to record:
- Average round-trip time (RTT)
- Packet loss rates
- Jitter (variability in latency)
- Time-of-day performance patterns
Establish baselines per site, per application, and per WAN path.
Tip 2: Use the Right Monitoring Tools
Recommended Metrics:
- ICMP/Ping RTT
- Traceroute hops
- SNMP interface utilization and errors
- TCP retransmissions
- Application-layer latency (HTTP, SQL)
Monitoring Tools (general categories):
- Network Performance Monitors (NPMs)
- Flow analysis tools (NetFlow, sFlow)
- WAN optimizer logs
- Cloud monitoring dashboards
- Syslogs from routers/firewalls
Tip 3: Correlate Latency with Utilization
High latency is often tied to bandwidth saturation or QoS misalignment.
Use SNMP or flow data to check:
- Interface throughput near capacity
- Queuing delays on routers
- Sudden traffic spikes (e.g., backups during business hours)
- Applications consuming unexpected bandwidth
Mitigate with:
- QoS policies
- Traffic shaping or policing
- Off-hours scheduling for large transfers
Tip 4: Perform End-to-End Traceroute and Path Analysis
A classic traceroute shows you the routers along the path and their response times.
What to look for:
- Sudden spike in latency at a specific hop
- Long delays near the destination
- Asymmetric paths (forward and reverse routes differ)
- Hops that drop ICMP (can mask issues)
For more visibility, use TCP or UDP-based traceroute tools which mimic actual traffic types.
Tip 5: Check for Packet Loss
Even small amounts of packet loss (1–2%) can dramatically increase perceived latency due to TCP retransmissions.
Use:
ping -n 100 -l 1400(Windows)mtrorping -s(Linux)- Router/switch error counters (CRC, input/output errors)
Identify if loss is:
- At the WAN edge
- Intermittent or continuous
- Application-specific or general
Tip 6: Validate DNS Resolution Time
Poor DNS resolution can mimic high latency. Always test:
nslookup app.company.com
Slow DNS adds delay before a session even begins. Use local DNS caching and low-latency DNS resolvers.
Tip 7: Evaluate MTU and Path MTU Discovery
Incorrect MTU (Maximum Transmission Unit) can cause fragmentation or black hole drops—leading to high latency or complete failure.
Check:
- MTU settings on WAN interfaces
- Use
ping -f -l [size]to test fragmentation - Enable Path MTU Discovery (PMTUD) where supported
Adjust or clamp MSS in firewalls or routers if needed.
Tip 8: Verify WAN Link Health
Use router and firewall diagnostics to check:
- Physical errors (CRC, alignment errors)
- Interface flaps
- Duplex mismatches
- Media type or SFP module errors
Use loopback tests or BERT tools for last-mile diagnostics.
Tip 9: Analyze Application Behavior
Some apps are more latency-sensitive than others.
- Citrix and RDP: Require stable, low latency
- VoIP/Video: Sensitive to jitter and packet loss
- SaaS apps: Often depend on multiple backend API calls
Use application performance monitoring (APM) to detect whether delays are network-related or server-side.
Tip 10: Collaborate with ISPs or Cloud Providers
If you’ve ruled out internal issues, work with external partners to:
- Reroute traffic through better-performing paths
- Identify peering or backbone issues
- Review SLAs and historical latency graphs
- Request BGP route adjustments
Document latency patterns and capture traceroutes to support your case.
Conclusion
Troubleshooting WAN latency requires a mix of monitoring, packet analysis, traffic pattern recognition, and a deep understanding of your network topology. By proactively measuring, correlating, and addressing latency at every layer—from cabling to cloud—you can ensure smooth and fast application performance for users across locations.


